Back in 2021, as inflation rates broke out from their long-term range, we discussed a study by the Man Institute about strategies for inflationary times. Now that prices appear to be stabilizing, we can look back and ask, “How did these assets do?”
 In Theory, These Are the Best Strategies for Inflationary Times
Commodities: In the study, the asset with the highest returns during inflationary environments was reported to be commodities, broadly speaking. Within this segment, the specific components the study indicated produce the best returns were, in order: energy, industrials, precious metals, and agricultural products. On the other hand, fixed income – particularly instruments with higher interest rate sensitivity – were noted as poor performers.
Trend-Based Strategies: From a returns perspective, the second best-performer during inflation, according to the Man Institute study, were trend-following strategies. Among trend-based strategies, diversified trend strategies and commodity-based trend strategies generated the best returns. Overall, trend-based strategies were second only to passive commodity portfolio. Passively holding equities and bonds did poorly in inflationary environments. Actively trading them via a trend following strategy did relatively well in terms of return.
In Practice (2021-2023), These Were the Best Strategies for Inflationary Times
Now to the more recent results.
For ease in assessing recent performance, I will focus on the three-year period that ended in December 2023. Candidly, I debated if 2021 returns should be included in the dataset because, in hindsight, they seemed relatively unfazed by the early inflation increase. However, I chose to include 2021 because inflation was clearly rising during the second half of 2021.
Similarly, since inflation rates began falling midway through 2022, one could argue that 2023 returns should be excluded from the dataset. However, given the lag of interest rate increases – in direct response to inflation – it seems reasonable to include 2023 as well for a fuller picture.
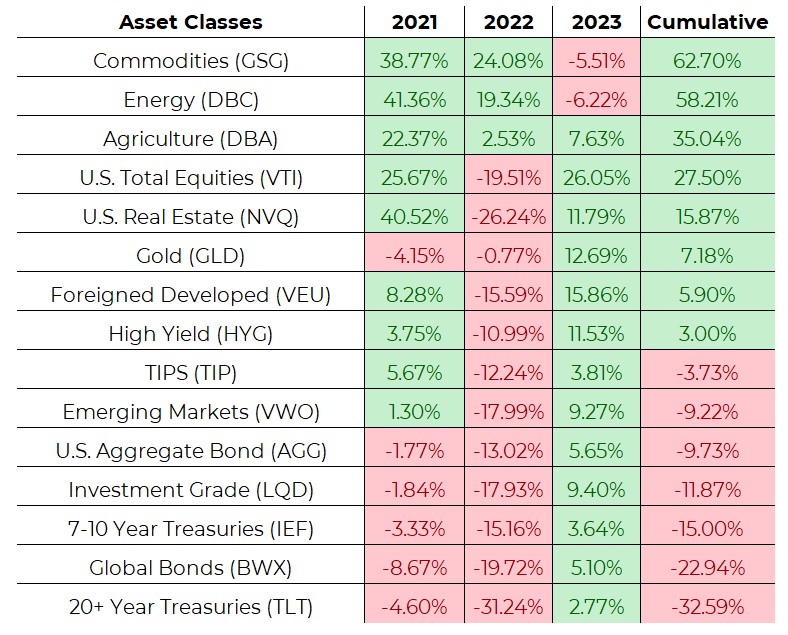
Asset Class Performance (1/1/2021 to 12/31/2023)
Source: Barchart.com, S&P GSCI Commodity-Indexed Ishares ETF (GSG), 1/1/2021 to 12/31/2023; Barchart.com, DB Commodity Index Fund Invesco (DBC), 1/1/2021 to 12/31/2023, Barchart.com, DB Agriculture Fund Invesco (DBA), 1/1/2021 to 12/31/2023; Barchart.com, Total Stock Market ETF Vanguard (VTI), 1/1/2021 to 12/31/2023; Barchart.com, Qraft Ai-Enhanced US Next Value ETF (NVQ), 1/1/2021 to 12/31/2023; Barchart.com, Gold SPDR (GLD), 1/1/2021 to 12/31/2023; Barchart.com, FTSE All-World Ex-US ETF Vanguard (VEU), 1/1/2021 to 12/31/2023; Barchart.com, High Yield Corp Bond Ishares Iboxx $ ETF (HYG), 1/1/2021 to 12/31/2023; Barchart.com, TIPS Bond Ishares ETF (TIP), 1/1/2021 to 12/31/2023; Barchart.com, FTSE EM ETF Vanguard (VWO), 1/1/2021 to 12/31/2023; Barchart.com, US Aggregate Bond Ishares Core ETF (AGG), 1/1/2021 to 12/31/2023; Barchart.com, Invst Grade Corp Bond Ishares Iboxx $ ETF (LQD), 1/1/2021 to 12/31/2023; Barchart.com, 7-10 Year Treasury Bond Ishares ETF (IEF), 1/1/2021 to 12/31/2023; Barchart.com, Intl Treasury Bond ETF SPDR (BWX), 1/1/2021 to 12/31/2023; Barchart.com, 20+ Year Treas Bond Ishares ETF (TLT), 1/1/2021 to 12/31/2023
Commodities & Fixed Income: As indicated in the Man Institute study, commodities led and fixed income lagged. Over the three-year sample shown in the table above, a representative commodity index (GSG) returned more than 60% while U.S. Treasuries with a duration greater than 20 years (TLT) dropped more than 30%.
Equities: During this same time, equities performed better than was the conclusion of the Man Institute study. However, it is possible that the three-year period’s data was skewed by the 2021 and 2023 performance, particularly due to a handful of tech-oriented listings (i.e., the Magnificent Seven stocks).
The bottom line is that assets generally performed as expected if we are to use the data in the Man Institute study as a benchmark.
Deeper Dive: 2022
Now let’s focus our attention on 2022 specifically, when the uncertainty was greatest regarding inflation, interest rates, and recession risk.
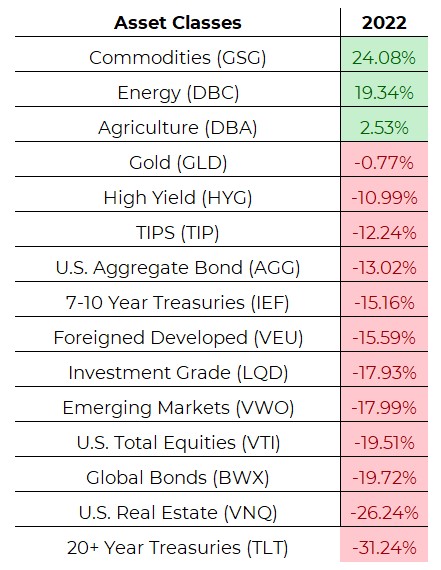
Asset Class Performance (1/1/2022 to 12/31/2022)
Source: Barchart.com, S&P GSCI Commodity-Indexed Ishares ETF (GSG), 1/1/2022 to 12/31/2022; Barchart.com, DB Commodity Index Fund Invesco (DBC), 1/1/2022 to 12/31/2022; Barchart.com, DB Agriculture Fund Invesco (DBA), 1/1/2022 to 12/31/2022; Barchart.com, Total Stock Market ETF Vanguard (VTI), 1/1/2022 to 12/31/2022; Barchart.com, Qraft Ai-Enhanced US Next Value ETF (NVQ), 1/1/2022 to 12/31/2022; Barchart.com, Gold SPDR (GLD), 1/1/2022 to 12/31/2022; Barchart.com, FTSE All-World Ex-US ETF Vanguard (VEU), 1/1/2022 to 12/31/2022; Barchart.com, High Yield Corp Bond Ishares Iboxx $ ETF (HYG), 1/1/2022 to 12/31/2022; Barchart.com, TIPS Bond Ishares ETF (TIP), 1/1/2022 to 12/31/2022; Barchart.com, FTSE EM ETF Vanguard (VWO), 1/1/2022 to 12/31/2022; Barchart.com, US Aggregate Bond Ishares Core ETF (AGG), 1/1/2022 to 12/31/2022; Barchart.com, Invst Grade Corp Bond Ishares Iboxx $ ETF (LQD), 1/1/2022 to 12/31/2022; Barchart.com, 7-10 Year Treasury Bond Ishares ETF (IEF), 1/1/2022 to 12/31/2022; Barchart.com, Intl Treasury Bond ETF SPDR (BWX), 1/1/2022 to 12/31/2022; Barchart.com, 20+ Year Treas Bond Ishares ETF (TLT), 1/1/2022 to 12/31/2022
Commodities: Zeroing in on 2022 yields a result even closer to the Man Institute study, with commodities being the only passively held assets offering a positive return.
Fixed Income: All other assets finished in negative territory, with higher-duration fixed income bringing up the rear.
TIPS: One other interesting note is the seemingly lackluster performance of so-called inflation-protected fixed income (i.e., TIPS). TIPS produced a slightly positive return in the Man Institute study but struggled mightily in 2022. The result is enough (for us anyway) to question the benefit of holding TIPS compared to another actively managed asset.
What About Trend-Following Strategies?
One obvious omission to our postmortem is the performance of actively managed trend strategies. In the interest of brevity, the goal of this blog was not to exhaustively recreate all aspects of the Man Institute study, but rather to focus on the underlying assets themselves.
With that said, we enthusiastically invite financial advisors to look further into different trend strategies and how they performed during the last few years. We would be happy to share our own results for any who are interested – feel free to reach out.
We continue to steadfastly believe that financial advisors can benefit greatly from partnering with a systematic asset manager to optimize their practice during various market environments. Advisors – and their clients – will endure a variety of scenarios over time: booms, busts, inflation, and recessions. We believe that the processes and strategies offer by Blueprint Investment Partners offer a great deal in the pursuit of that optimization.
