In November, The Ringer’s Danny Chau published an article about the unique abilities of NBA superstar James Harden, whose absurd level of play this season has made him an MVP favorite. In the piece, Chau recounts a conversation with Dr. Marcus Elliott of P3 Applied Sports Science, a performance facility that uses advanced technology to test the physical capabilities of athletes. According to Elliott, “Harden is barely average in almost every metric we look at related to athleticism, except for deceleration metrics. And in those he’s one of the best athletes we’ve ever measured in any sport — in soccer, football, or basketball.” In other words, Harden is world-class at slowing down. The Houston Rockets’ All-Star guard does not need to out-run, out-lift, or out-jump his opponents to beat them off the dribble- Harden’s preternatural ability to stop on a dime allows him to create the space he needs to score while his defenders fly into the first row of the stands.
The virtue of efficiently stopping applies across many fields, including investing. During bullish upmarket periods – such as the one US stocks have been experiencing since 2009 – investors seem to succumb to an only slightly-restrained mania that causes them to throw caution to the wind. Fairly often, we hear some version of the following from advisors via their clients: “The market is up X% and you’re only up Y%! What’s going on?” Setting aside the fact that principles of asset diversification would prevent any prudent portfolio from tracking the domestic stock market directly, it’s important to ask the question: do you really want the unimpeded stock market return, with the wild volatility and massive drawdowns that entails? If the prospect of careening into the bleachers doesn’t unsettle you, it's easier than ever before to invest in passive index funds that track the S&P 500. Why pay an advisor a management fee for a passive index return you can easily get yourself?
At Blueprint, we believe that active management is a better way to invest. When our systems tell us that domestic stocks are entering a downtrend, we put on our brakes and shift our resources to other asset classes.
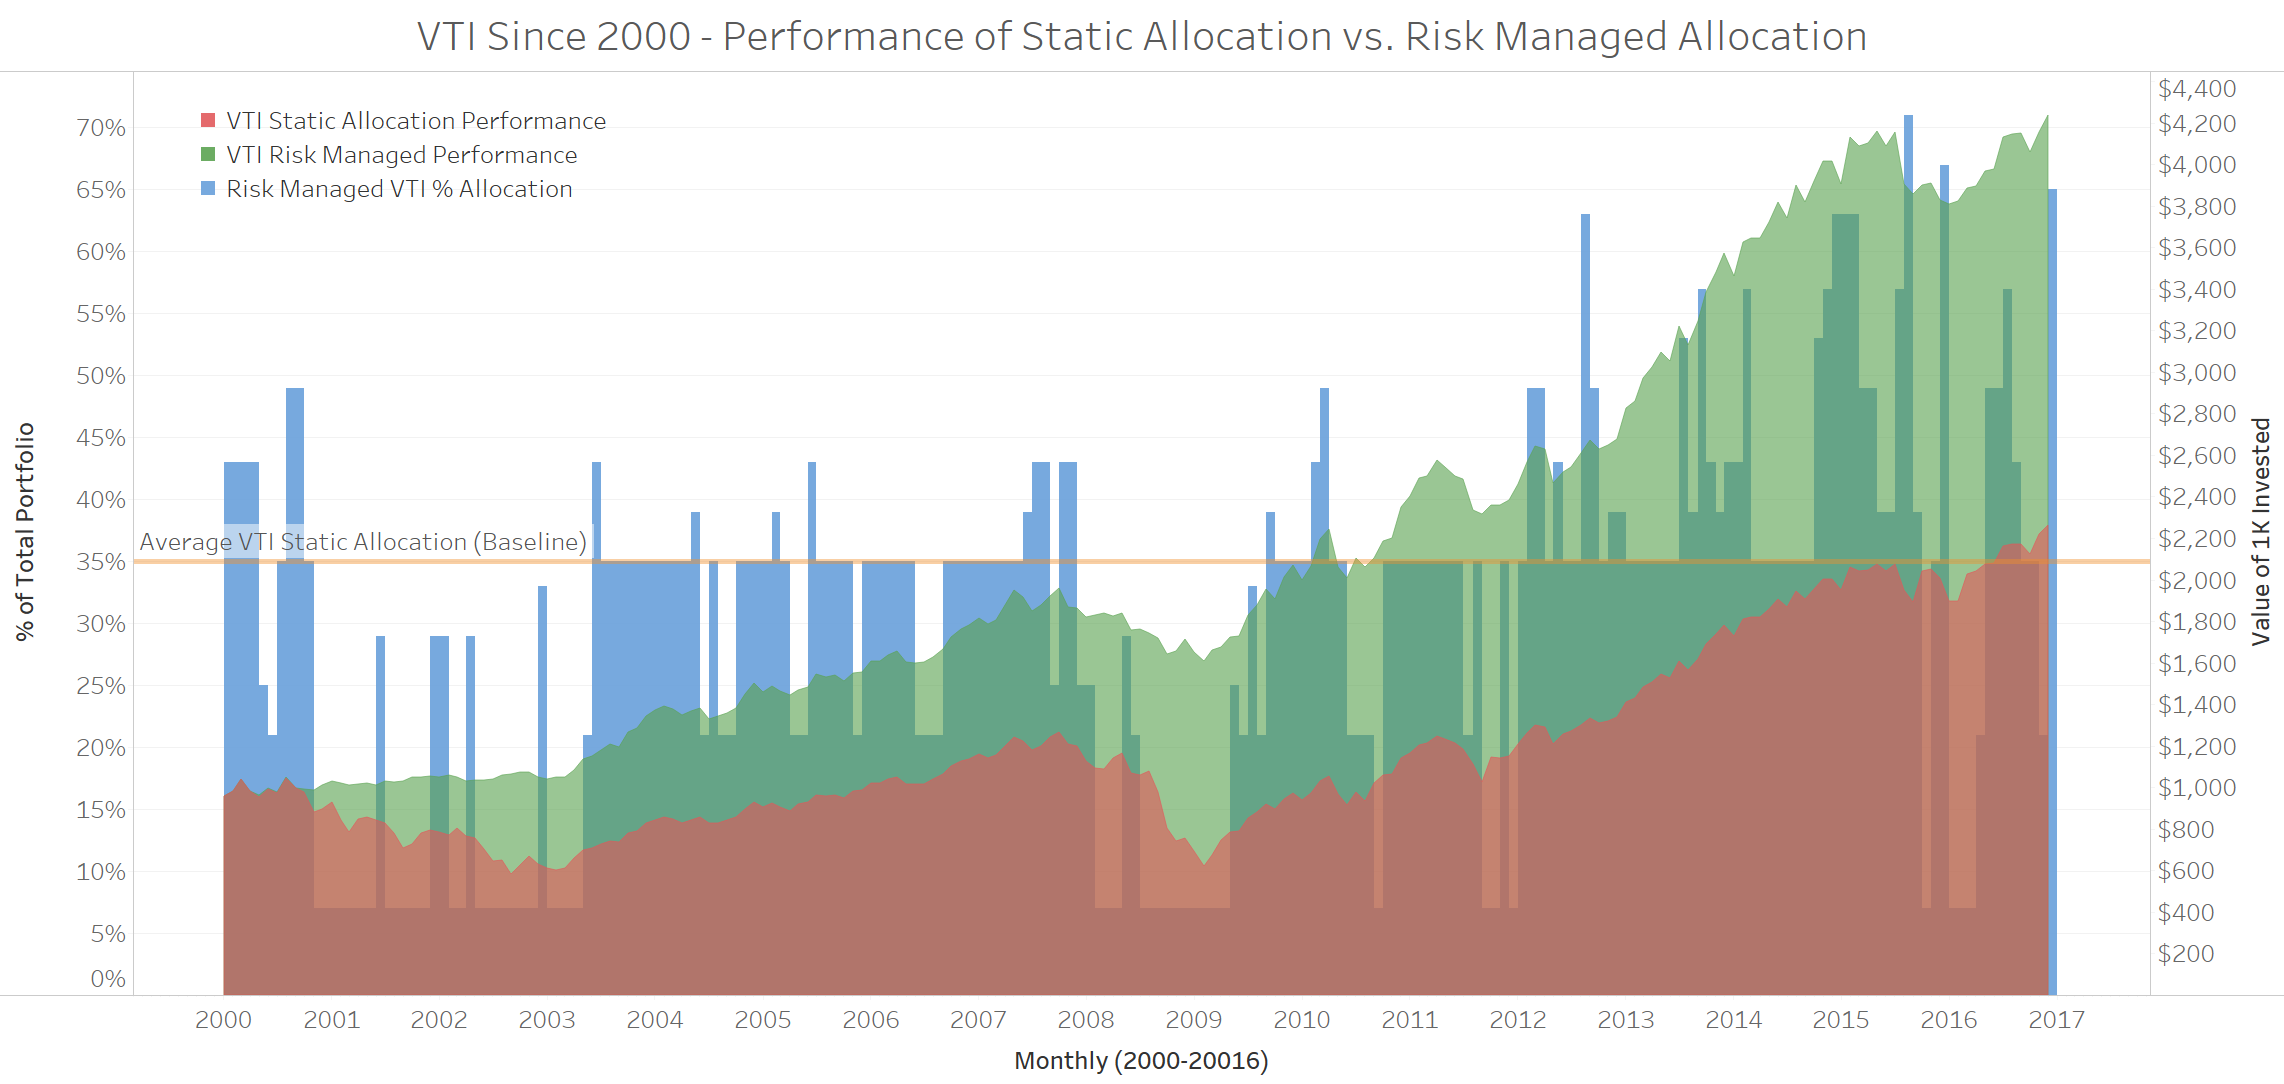
Indeed, over long time horizons, we seek to outperform domestic stocks, and accordingly, this requires a lack of correlation to S&P 500 index returns. This is music to the ears of clients during periods of equity market crises, but it can be a tough pill to swallow when stock prices seem to be shooting straight up. However, short-term performance drags during bull markets are more than made up for by avoiding huge losses during equity market meltdowns. Examine the double graph below:
Past performance does not guarantee future results.
The left Y-axis, vertical pink bars and horizontal blue line represent a monthly percentage-based portfolio allocation to the Vanguard Total Stock Market ETF (VTI). The right Y-axis, green line and red line represent the value over time of an initital $1,000 invested in January 2000. Given the emotional difficulties of being completely out-of-line with the market, our risk-managed allocations are 80% determined by our trend systems and 20% determined by a strategic, buy-and-hold portion. This means that even when our trend systems would have us out of the market, we would, for this example, maintain a 7% allocation (20% of the static 35% baseline). As you can see, since 2000, the risk-managed strategy greatly outperforms the static allocation strategy by mostly avoiding the harmful effects of the Early 2000s Recession and the Global Financial Crisis.
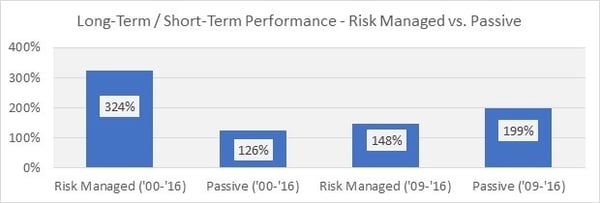
But let’s look more closely at the relative performance of these strategies since 2009:
Past performance does not guarantee future results.
As shown in the graph, since January 2009, the risk-managed strategy underperforms the static allocation strategy by over 50%! Yet, because the risk-managed strategy avoids the huge losses that plague the static allocation strategy between January 2000 and January 2009, the risk-managed strategy outperforms the static allocation strategy by 197% between January 2000 and January 2017!
Additionally, the post-financial crisis performance of the risk-managed strategy is up nearly 148% on a cumulative basis against the static allocation strategy which is up an incredible 199%. This bull market performance drag, while necessary to avoid correlation during bear markets, amplifies the emotional biases that make a risk-managed strategy difficult to employ, despite the long-term benefits.
And so, as we enter the 9th calendar year of the 2nd-longest bull market in US history with a new political and regulatory landscape, we ask: What is your risk management process? Is it time to review your approach? All our knowledge, experience and research tells us that risk management is exactly what is needed given the current environment. We value stopping. Do you?

