The Wall Street Journal recently published a profile piece about Will Danoff, the manager of Fidelity’s Contrafund (FCNTX), which got us thinking. As stated in the piece, the $108 billion Contrafund has averaged a 12.7% annual return since Danoff took over the fund in September 1990, outperforming the S&P 500 index by 2.9 percentage points per year. Contrafund’s performance has indeed been tremendous, as shown in the following graph when compared to the S&P 500:
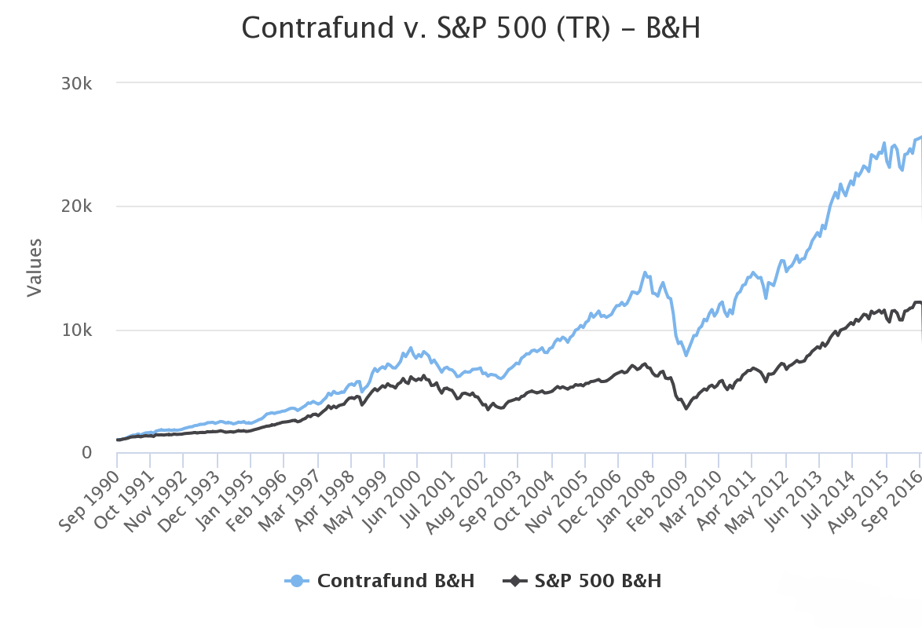
Past performance does not guarantee future results.
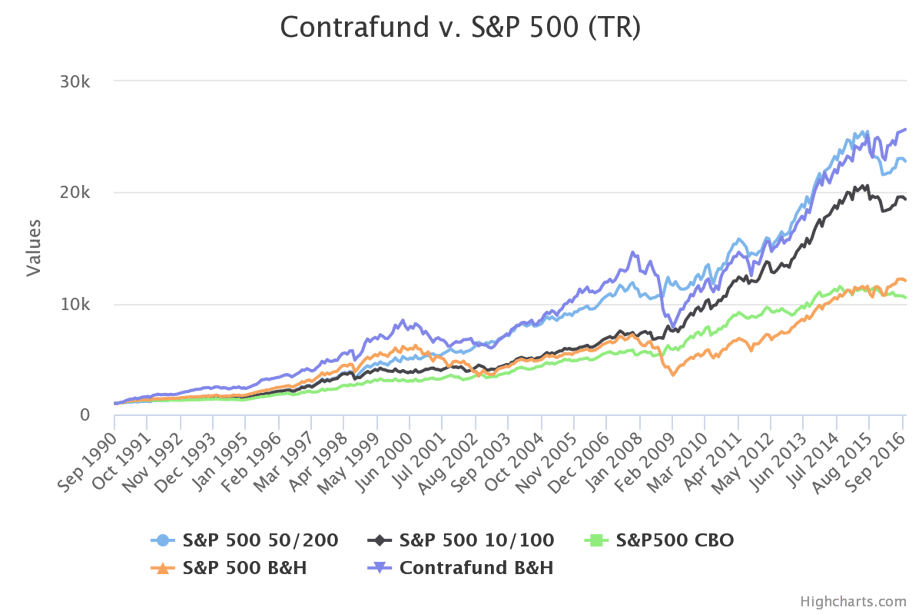
First, we were interested to see if it were possible to achieve a similar result applying trend following to a passive investment such as an S&P 500 Index ETF. We asked ourselves: “Could the S&P 500 ‘catch up’ to the Contrafund just by applying trend?”
We examined the performance of three trend following strategies:
- 50 EMA/200 EMA: own fund when the 50 day EMA is above the 200 day EMA, otherwise move to short-term bonds (PIOBX)
- 10 EMA/100 EMA: own fund when the 10 day EMA is above the 100 day EMA, otherwise move to PIOBX
- 100-Day Channel Breakout: own fund when price reaches a 100-day high and sell when price reaches a 100-day low, moving to PIOBX until a new 100-day high is reached
The graph below measures the total return since September 1990 for these three systems with the S&P 500, as well as buy and hold for both Contrafund and the S&P.
Past performance does not guarantee future results.
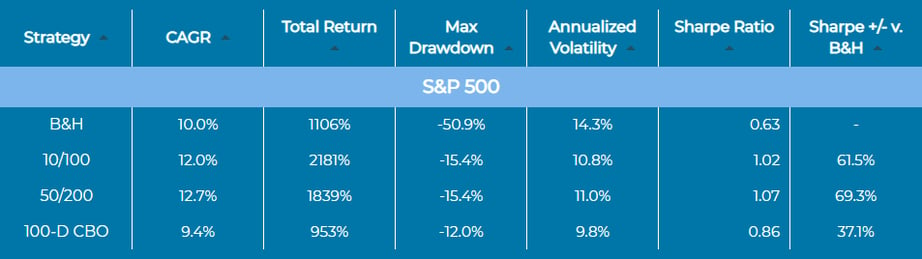
As shown, on an absolute basis the Contrafund slightly outperformed a 50/200 day trend system applied to the S&P 500 over the sample. However, on a risk-adjusted basis, the S&P 500 with trend following outperformed Contrafund in 2 of 3 scenarios.
Past performance does not guarantee future results.
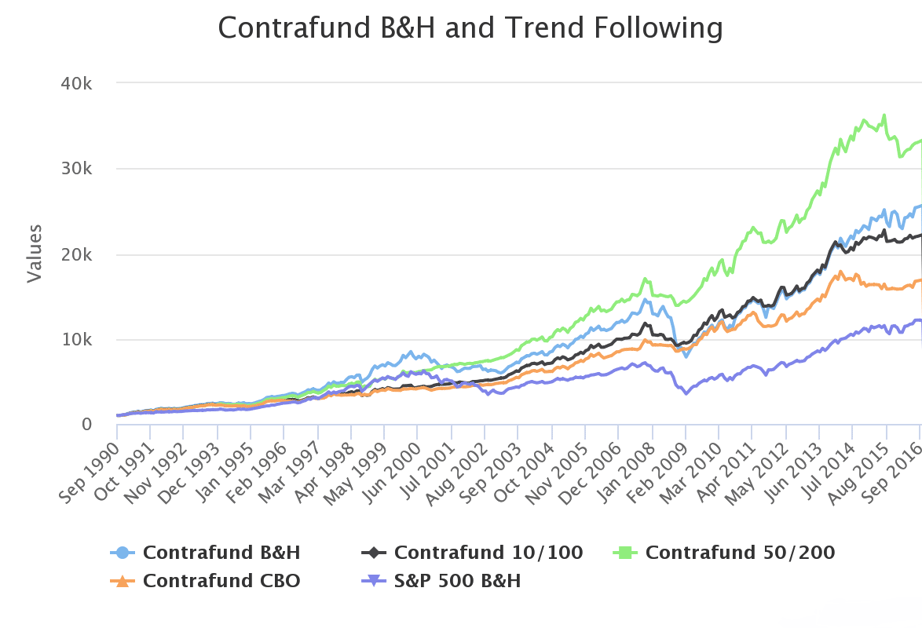
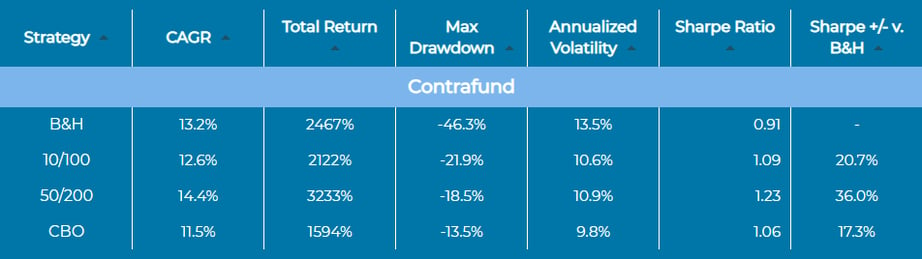
But let’s take it one step further – how would trend following perform when applied to Contrafund itself? The graph below shows the results when the same trend following strategies are applied to Contrafund:
Past performance does not guarantee future results.
A 50/200 day trend signal system applied to Contrafund since September 1990 outperformed Contrafund’s returns primarily by avoiding many of the impacts of large drawdowns during the tech crisis and financial crisis, as shown below:
Past performance does not guarantee future results.
The 50/200 system applied to Contrafund experienced a 14.4% compound annual growth rate, relative to Contrafund’s 13.2%, but with only 10.9% volatility compared to 13.5% for Contrafund. Accordingly, the 50/200 system produced a Sharpe ratio of 1.23, a large improvement over Contrafund’s 0.91. On average, by applying a trend following system to the Contrafund, the risk-adjusted performance (as measured by Sharpe) improved by 36% over the sample. In sum, trend following is such a robust, timeless concept that can allow investors to improve absolute and risk-adjusted results, even when using the best actively-managed funds.

