Clients and partners of Blueprint know how much we value communication and transparency. We are not shy about being transparent (some would say to a fault), from putting our exact investment rules on our website to explaining in detail how these rules work. One thing that we (and the world) are learning in 2020 is that despite how we miss interacting with our clients, friends, and partners in person, we can still add value and communicate effectively through a variety of other, tech-driven mediums. Case in point: as of December 2019, the number of free and paid Zoom meeting participants was 10 million; today, it's 300 million!
Every month, on the last trading day when we rebalance our portfolios, we send a note to our clients and partners with an update on changes in the model and the status of price trends based upon our rules and systems. This month, we want to again share it with our full audience, because we believe it is insightful regarding the current environment, and because we are proud of our work.
To receive Blueprint Monthly Updates going forward, please click here to sign up.
To all Blueprint Clients and Partners:
April 30, 2020
First, we sincerely hope this note finds everyone safe and healthy in your world. We are reminded during times like these of how grateful we are to be here to serve our clients and friends.
Below are the asset classes utilized in Blueprint portfolios and their model-driven exposure heading into May. For a full-page PDF please click here.
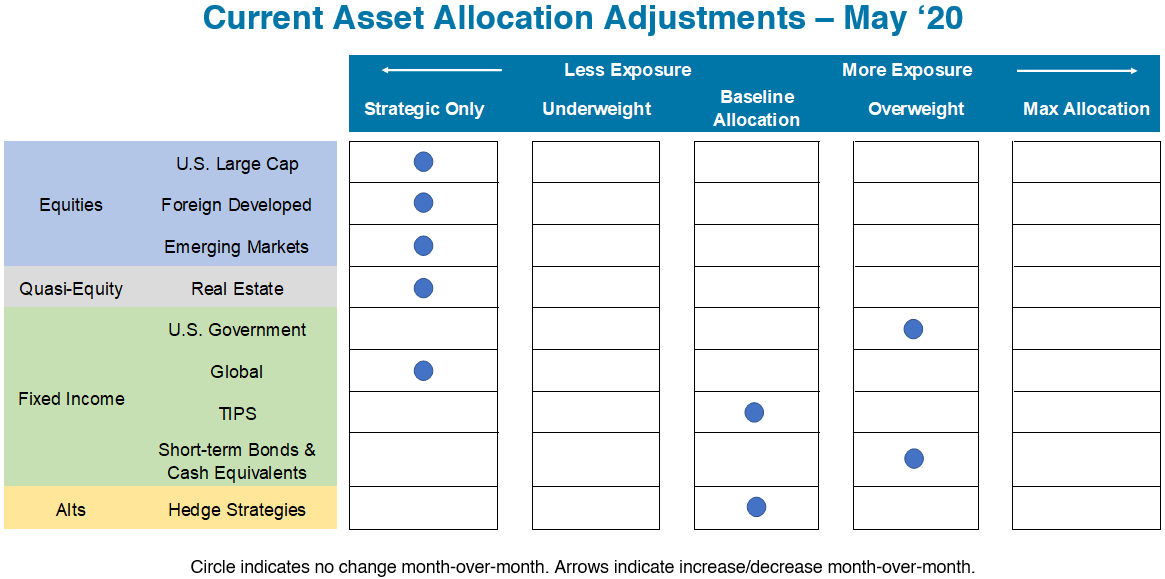
At a Glance: Allocation Adjustments as of April 30, 2020
- U.S. Equities: no change to the minimum allocation due to continued downtrends in all timeframes.
- International Equities: no change to minimum allocations due to continued downtrends in all timeframes for both Foreign Developed and Emerging Markets.
- Real Estate: no change to the minimum allocation due to continued downtrends in all timeframes.
- Fixed Income: remains in uptrends across all timeframes for U.S. Bonds. International Bonds continue to experience downtrends across all timeframes. Overall, Fixed Income exposure will be unchanged from last month.
- TIPS: no change to exposure with uptrends remaining across all timeframes.
- Short-Term Notes and Cash Equivalents: no change as it continues to take on allocations from weaker equity and bond segments.
Asset Level Overview
Equities and Real Estate
Despite spending much of April rebounding from lows in March, stocks across all capitalizations and geographies around the globe remain firmly entrenched in downtrends. Therefore, each of these asset classes will remain at their minimum allocation in all Blueprint portfolios. As is typical of bear markets, equity asset classes have retraced a significant portion of the decline only to remain below their long-term averages as April concludes. Our data indicates that subsequent to waterfall declines in stock prices, large, unabated bounce backs are consistent among the major modern U.S. bear markets. At this point however, the potential recovery pattern whether ‘V’ or ‘W’ shaped remains unknown.
Fixed Income
Further adding to the evidence of the current downtrend environment in U.S. equities is that Fixed Income asset classes remain at or near their highs with the exception of International Bonds. Even with double-digit recovery in U.S. Stocks, U.S. Bonds have given back very little of the gains from Q1. Consequently, Blueprint will continue to be overweight Fixed Income, concentrated mostly in lower duration instruments.
Three potential macro catalysts for the recent trend changes:
- More U.S. Government Stimulus: The House of Representatives overwhelmingly passed a $484 billion spending bill to replenish a new but swiftly depleted program providing loans to small businesses, as well as to provide further funding for coronavirus testing and hospitals.
- Declining Macro Economic Indicators: The National Association of Realtors reported that existing home sales fell to their lowest level in a year in March, before the full onslaught of the coronavirus crisis and stay-at-home orders. Additionally, the Labor Department reported that another 3.8 million Americans filed jobless claims in the week ended April 25, bringing the six-week total to more than 30 million.
- International Stimulus Packages: The Bank of Japan expanded monetary stimulus and pledged to buy an unlimited amount of bonds to keep borrowing costs low, as the government tries to spend its way out of the growing economic pain from the coronavirus pandemic. Also, European Union finance ministers agreed on an additional €500B worth of support, bringing the EU’s total fiscal response to the epidemic to €3.2 trillion.
Still a Long Way to Go
The title of our closing section this month refers both to the distance from making new highs in U.S. equities and also the time until we will know how our current predicament plays out. Despite rising almost 30% from lows, U.S. stocks need another 20% to re-gain their February 19 close. Additionally, the rise has been largely driven by only five stocks (MSFT, AAPL, AMZN, GOOGL, FB). It is worth noting that these five stocks now make up nearly 20% of the S&P 500, the highest percentage of the top five companies in the index since 2000. With domestic production grinding to a halt and unemployment skyrocketing, it is difficult to fathom a return to highs anytime soon, even for us who eschew prediction and believe anything is possible (as the current pandemic proves).
We have previously written about the difference between asset class price shocks and bear markets. What makes the Coronacrash statistically interesting is that the pace of the decline is more comparable to a shock such as 1987 but the severity akin to the early stages of a prolonged bear market like 2008, especially given the broad economic intervention by the government and deep uncertainty about the subsequent recovery.
The Data
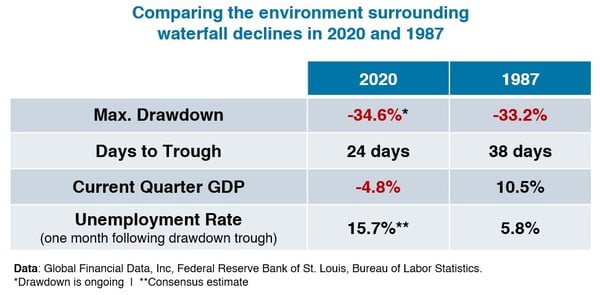
In 1987, the S&P 500 fell 33% in only 38 days, by far the fastest decline of the modern era up to that point, with the initial trough being the infamous Black Monday of October 19th. If you ignore the first 3% of the decline and start counting on October 1st 1987, you could re-state to say that the market fell over 30% in 13 days. After hitting an intraday bottom on October 20th, the index subsequently rebounded 13% by November 5th before re-testing and eventually closing at a new low on December 4th. From there, the index steadily climbed until it finally made new highs on July 26th…of 1989, the 4th fastest increase from a 20% drawdown since 1950 (484 trading days). Interestingly, GDP never contracted (the definition of recession) in or around the 1987 crash and unemployment actually DECREASED.
Now contrast to where we stand thus far in 2020. From the February 19th high, the index fell 34% in 24 days and has recovered approximately half of its decline in less than a month. No one knows the full economic impact yet but GDP is already contracting as evidenced by Q120’s 4.8% drop to go along with over 30 million new jobless claims over just the last 6 weeks. A similar recovery to 1987-1989 would put our next new equity high at the end of 2021 or early 2022. The table below summarizes this data.
We provide this data not to scare advisors who are working tirelessly to serve their clients, but rather to provide valuable context and offer a solution to help them weather these stormy times. The question advisors have to ask themselves is whether they want to bet on a better recovery than 1987 in the face of a substantially worse economic environment in 2020.
The other option is they can join advisors who are already partnering with Blueprint to experience reduced volatility and drawdowns, all while having a systematic plan already enacted to offset risk within their larger portfolios. If risk remains high we will remain defensive. If intervention is enough to lift us from the worst then we will look for opportunities according to our pre-planned rules. This allows advisors to focus on communicating with clients and keeping them on the path to achieve their financial goals.
For more on how Blueprint Strategies can help you succeed in your practice, please feel free to call me directly for additional information or details. We are always pleased to discuss the current environment with you and are equally interested in your thoughts.
To receive Blueprint Monthly Updates going forward, please click here to sign up.
Best,
Jon
Jon Robinson
Co-Founder & CEO
e: jon.robinson@blueprintip.com
c: 336-451-9792
Brandon Langley
Co-Founder & President
e: brandon.langley@blueprintip.com
c: 336-430-0240
![]()