As anyone who has read Blueprint insights over the last few years knows, we believe in two types of diversification. First, asset diversification is a keystone of investing and we embrace the benefits. Second, we add time diversification using trend following techniques to mitigate the vagaries and cycles of markets. Why? Because, historically, when given enough time (say 20 years), asset diversification (buy and hold) has been almost unbeatable. However, humans do not naturally invest or even think that long term and struggle with staying the course when the market inevitably course corrects either in a short-lived correction or sustained drawdown. This in turn reduces the probability of achieving their long-term financial objectives. Please allow me to elaborate.
.jpg?width=700&name=shutterstock_767539465%20(1).jpg)
Diversification Is Important – How You Accomplish It Is Critical
Let us first stipulate that since 1950, with a time frame of at least 10 years, a buy and hold (BH) 60/40 portfolio of the S&P 500 and U.S. Treasury Bonds provided a positive return 100% of the time, an improvement over buying stocks alone. This is asset diversification at its finest and is illustrated on the left side of the table below. The right side of the table shows the benefits of adding time diversification.
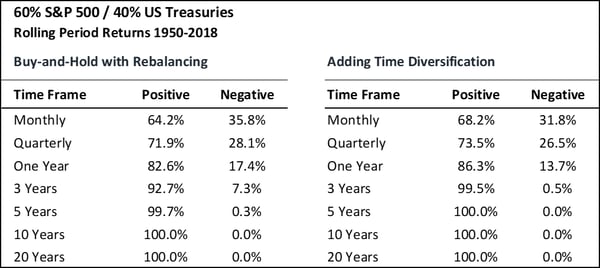
Source: Blueprint calculations, based on data from Global Financial Data (GFD) and Commodity Systems, Inc. (CSI). The following chart has been presented for illustrated purposes only. Past performance is not indicative of future results.
A more important statistic behaviorally though, is how often your asset values are growing, versus declining or recovering from a decline. Since 1950, the 60/40 buy and hold portfolio achieved new highs in approximately 40% of the months over that period, but adding time diversification improved this ratio to 42%. As Prospect Theory states, the pain of a loss is 2x the joy of a gain, thus improving the growth/positive outcome ratio only marginally provides meaningful results in terms of behavior and compounding.
Our research supports that adding time diversification as an overlay to asset diversification provides an improved outcome. Systematic trend following processes, such as those at the core of the Blueprint Strategies, provide two important benefits:
- Increases the probability of meeting your return goal: When comparing both buy and hold (BH) and a trend strategy against a growth goal, the trend strategy maintains asset levels above goal more frequently. This is true in terms of both growth and volatility. Let’s assume an 8% compounding return objective. Since 1950 using a 60/40 portfolio, a trend-based approach achieved an 8% annualized return or better 77% of the time. BH produced at least that rate 49% of the time. The difference represents an improvement of almost 60%. This is illustrated below and leads us to the next benefit.
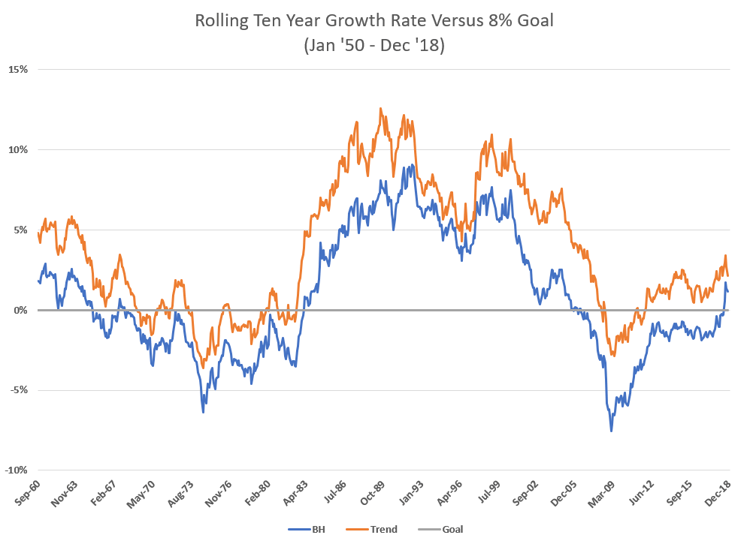 Source: Blueprint calculations, based on data from Global Financial Data (GFD) and Commodity Systems, Inc. (CSI). The following chart has been presented for illustrated purposes only. Past performance is not indicative of future results.
- Provides superior compounding: I often say you cannot spend annual returns; you can only spend dollars. If asset values spend more time at a higher level, those dollars compound at a faster rate. It is important to evaluate both the time spent at or above goal, and the expected deviation from that goal. This is also illustrated in the graph above. Not only does the trend-based process spend more time above the goal, this occurs at an increasing magnitude. In fact, if one looks at the median (or expected) result in the graph above they will see that BH is almost exactly on goal (0%) while Trend is 3% above goal (+3%) since 1950. While this may seem to be a marginal difference, consider that compounding above goal creates a buffer for the investor to protect from market events or life changes. More importantly, the cumulative benefit of compounding in terms of dollars creates a compelling financial outcome. Again, the dollars matter.
To illustrate this point, the graph below outlines the dramatic effect that compounding can have over 10, 20 and 30-year periods. The difference in 3% compounded over 10-years translates into $6,266 (32%). If you take that out to 30 years, the difference becomes $98,371 (130%).
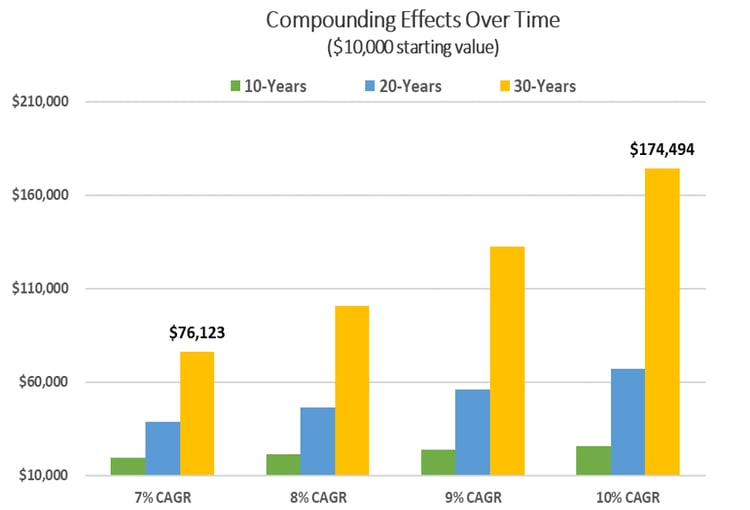
Source: Blueprint calculations, based on data from Global Financial Data (GFD) and Commodity Systems, Inc. (CSI). The following chart has been presented for illustrated purposes only. Past performance is not indicative of future results.
Time frame matters
The investment community is becoming more aware of the behavioral aspects of investing every day, and more advisors are seeking tools and resources that provide what we refer to as behaviorally friendly strategies. We seek to evangelize these concepts and intend to democratize what have historically been black box techniques buried in a 2/20 limited partnership fund.
Almost everyone agrees that investing requires a solid strategy and patience. Again, asset diversification will perform well over a long enough period. We believe that a robust, elegant and well-executed system incorporating time diversification can enhance the ultimate outcome, and the ride.
For more thoughts on ways to evolve your investment approach and reduce the impact of human behavior on investment decisions visit www.blueprintip.com

